Modular Logistics Dashboards: Types, KPIs, Architecture, and Power BI Guide
Date
Nov 18, 25
Reading Time
9 Minutes
Category
Enterprise Solutions
Share
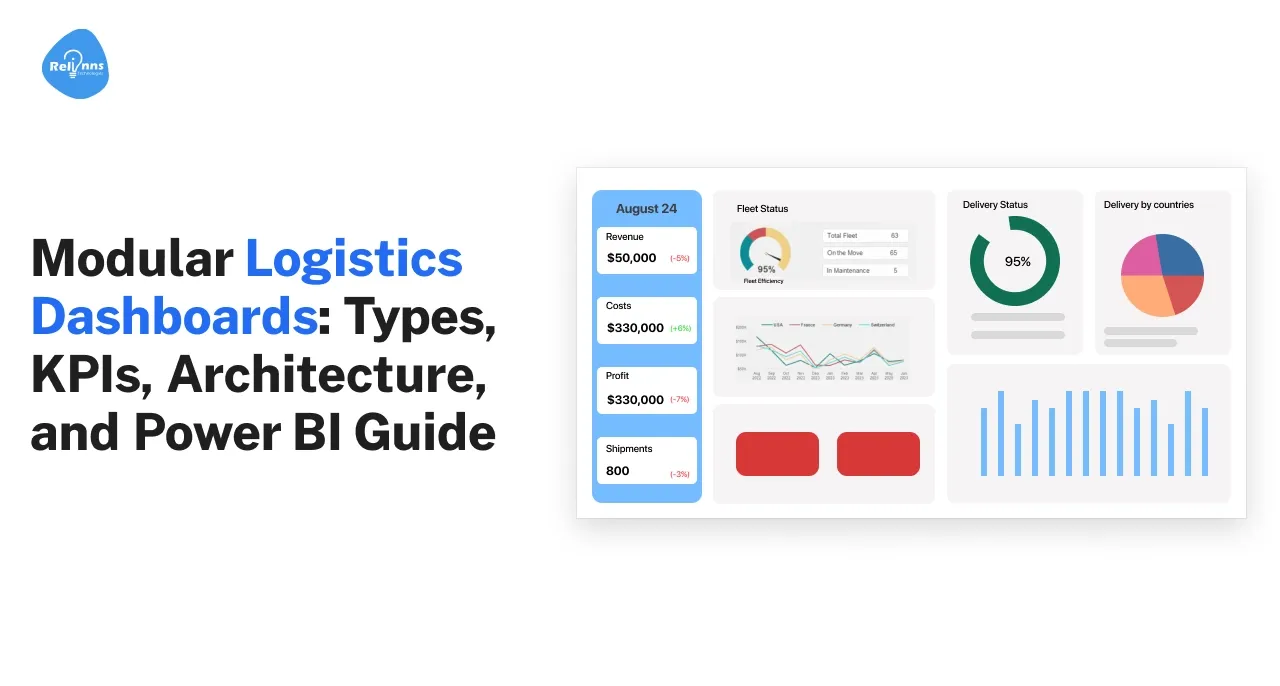
Logistics leaders juggle transport, warehousing, returns, and partner networks with data scattered across tools.
Decisions slow down when KPIs live in spreadsheets and yesterday’s snapshots.
Modular logistics dashboards fix this by turning live signals into shared, role-based views that guide action.
In this article, we define a practical dashboard blueprint, map must-have modules, and share an implementation playbook that scales from pilot to enterprise, using logistics dashboard patterns, reverse logistics KPI dashboard designs, logistics analytics dashboard methods, and Power BI logistics dashboard deployment tips.
What Are Modular Logistics Dashboards?
Modular logistics dashboards are composable, role-based visual workspaces that combine live data, KPIs, and guided workflows across transport, inventory, and returns.
Each module can be deployed independently, then stitched together via a consistent data model and access controls. This lets teams start small, add capabilities quickly, and avoid monolithic, one-size-fits-all screens that no one opens.
For operations, “modular” means speed: faster rollout, faster iteration, and clearer ownership of each dashboard’s outcomes.
Modular vs Monolithic Logistics Dashboards
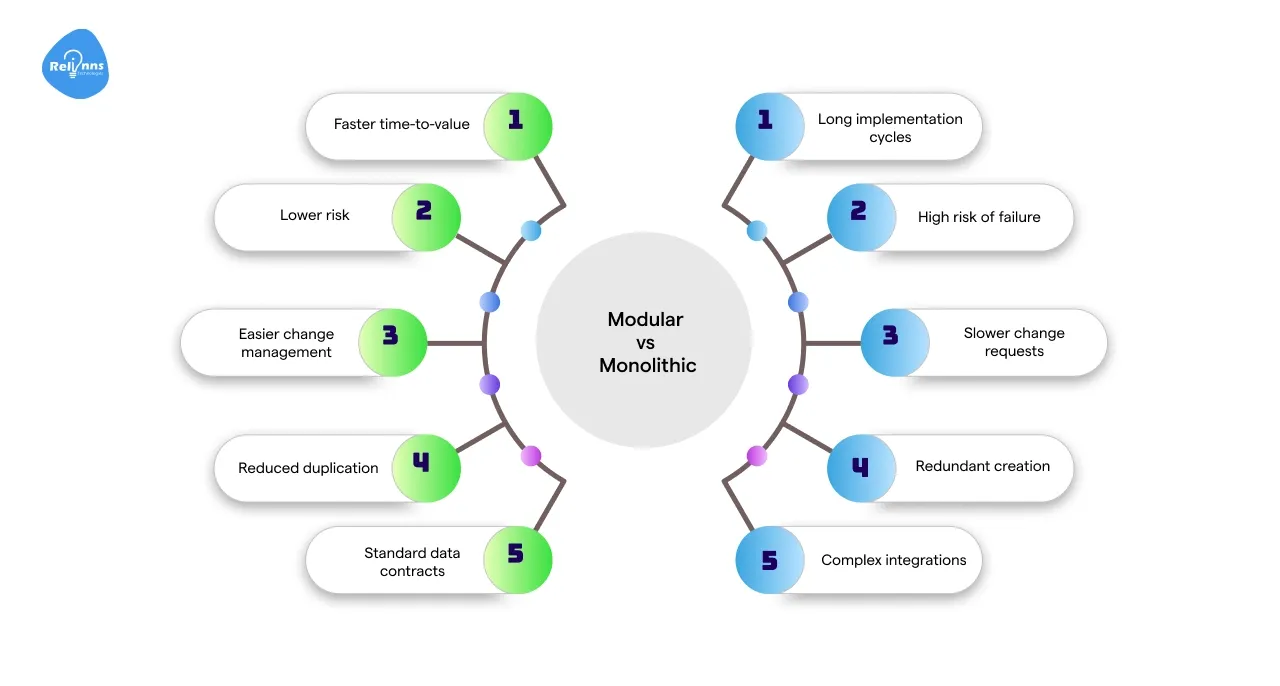
Modern logistics operations generate high data volumes across transport, warehouse, and reverse flows. Choosing between modular logistics dashboards and monolithic systems determines scalability, speed, and cost.
Modular dashboards enable phased rollouts, rapid iteration, and customization, while monolithic ones risk rigidity and slow adoption across departments.
Aspect | Modular Logistics Dashboards | Monolithic Dashboards |
| Deployment Speed | Faster time-to-value for a single department or lane. | Long implementation cycles; difficult to deploy incrementally. |
| Risk Management | Lower risk by isolating scope, users, and data dependencies. | High risk of failure if one module or dataset breaks. |
| Change Management | Easier change management with clear owners and training needs. | Centralized ownership slows change requests and updates. |
| Reusability | Reusable tiles and KPIs reduce duplication and maintenance. | Duplicate reports and visuals are often created manually. |
| Integration & Governance | Standard data contracts, simpler integrations, stronger governance. | Complex integrations and inconsistent governance structures. |
Core Design Principles for a Logistics Dashboard
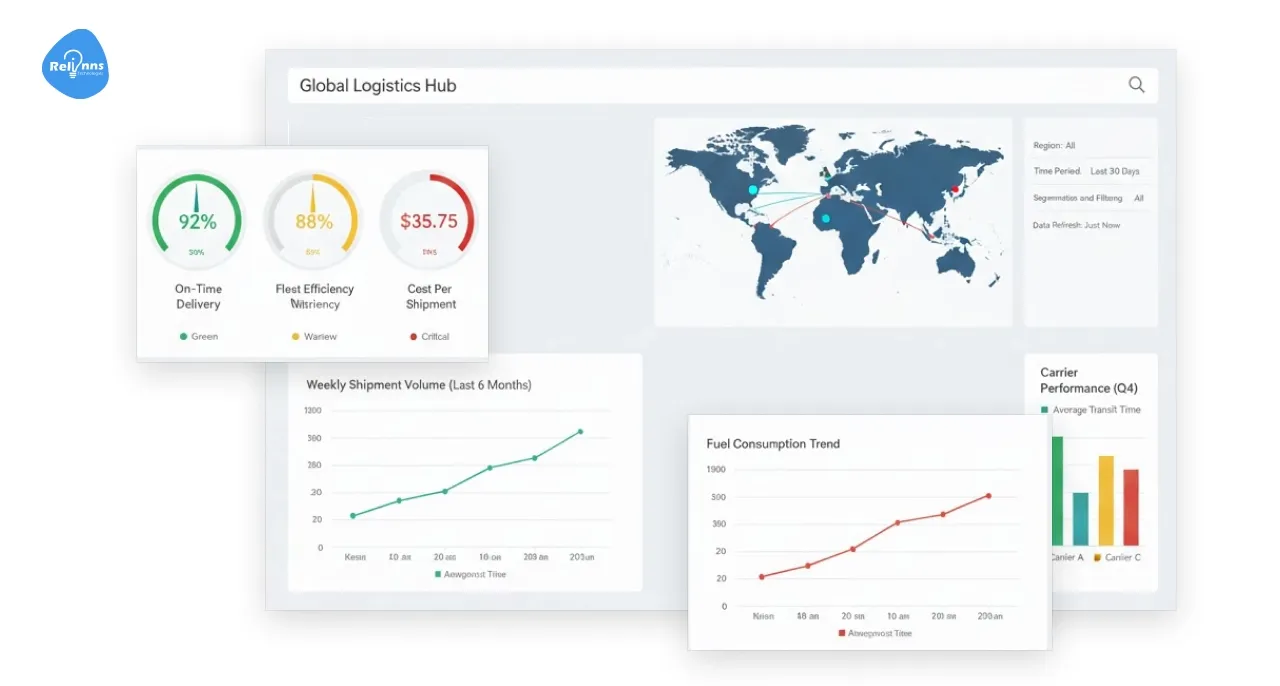
A successful logistics dashboard balances clarity, actionability, and governance.
It must answer “What’s happening, why, and what should we do next?” while enforcing naming standards, shared time zones, and uniform filters.
Each page should support drill-downs from executive summaries to lane-level and order-level evidence, without forcing users to export to spreadsheets.
Design Principles to Enforce from Day 1
- Prioritize 5–10 KPIs per view, each with a plain-English definition.
- Pair every KPI with a “next step” or playbook link.
- Keep filters consistent across modules to reduce confusion.
- Show trends, targets, and variance, not isolated numbers.
- Log all changes to formulas and thresholds for auditability.
Types of Logistics Dashboards for Modern Operations
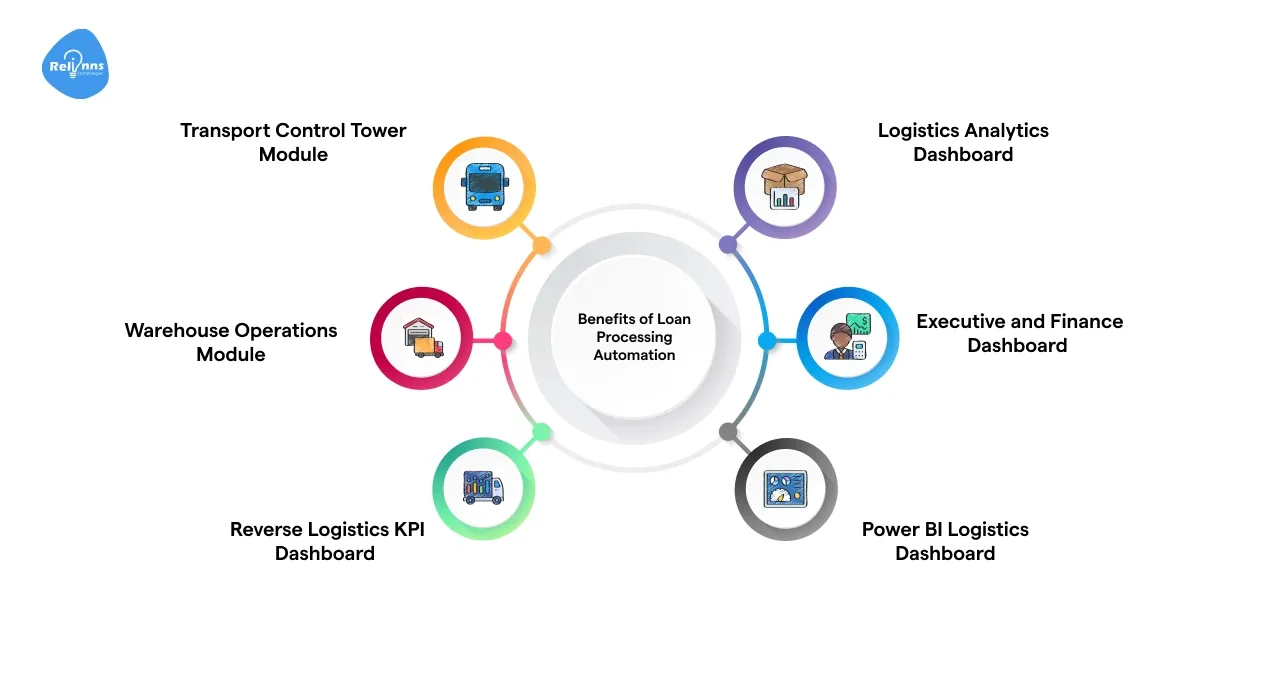
Data-driven logistics operations rely on multiple dashboard types, each serving a specific purpose, from real-time transport control to financial oversight.
Together, these modules form a modular logistics dashboard ecosystem that connects operations, analytics, and leadership insight.
1. Transport Control Tower Module
A transport module in logistics dashboards provides live network awareness, including route adherence, ETA variance, dwell time, and carrier performance.
It merges telematics, TMS milestones, and driver events, then surfaces ranked exceptions with guided playbooks.
Done well, it shifts the culture from “monitoring” to “intervening.”
Minimum Viable Tiles for Transport
- On-time pickup and delivery, with lane- and carrier-specific variances.
- Live map with geofences, congestion overlays, and ETA confidence.
- Dwell time by yard, gate, ramp, and shipper location.
- Route deviation alerts with re-route and notify actions.
- Cost per mile and empty miles, benchmarked weekly.
2. Warehouse Operations Module
Warehouse performance drives fulfillment speed and cash flow.
A warehouse module within logistics dashboards tracks throughput, pick accuracy, aging inventory, and dock utilization.
It correlates pick-pack-ship metrics with transport OTP to expose systemic flow problems, not isolated misses.
Warehouse Tiles that Matter Most
- Receiving cycle time, put-away latency, and dock door congestion.
- Pick rate, pick accuracy, and rework by zone and shift.
- Backorders and service levels are linked to inventory positioning.
- Aging inventory and safety stock breaches by SKU family
- Cost per order fulfilled and per carton picked.
3. Reverse Logistics KPI Dashboard
Returns and refurb flows are a profit lever, not an afterthought.
A reverse logistics KPI dashboard focuses on the path from RMA creation to disposition, recovery value, and resale lead time.
It helps you decide when to repair, refurbish, restock, or recycle based on economic and SLA factors.
Essential Reverse Logistics KPIs
- Return rate by SKU, channel, and reason codes.
- Cost per return, including transport, handling, and testing.
- Disposition mix: restock, refurbish, recycle, write-off
- Recovery value and resale cycle time by category.
- Warranty claims volume and approval lead time.
4. Logistics Analytics Dashboard
Descriptive metrics explain what happened.
A logistics analytics dashboard adds prediction and prescription, using historical series plus current signals to forecast volume, risk, and capacity needs.
The goal is to propose actions, not just report trends.
Analytics to Elevate Beyond Reporting
- ETA accuracy modeling by lane, carrier, weather, and dwell.
- Demand and capacity forecasts tied to labor and fleet plans.
- Cost-to-serve models at SKU, region, and customer tiers.
- What-if scenarios for disruptions, strikes, and port congestion.
- Anomaly detection for fraud, shrinkage, and mis-scans.
5. Executive and Finance Dashboard
Executives need a cross-module view that unifies transport, warehouse, and returns economics.
This page aligns cash, cost, and service by quarter and region, so strategy changes are backed by operational evidence rather than anecdotes.
Executive-friendly Tiles to Standardize
- Perfect order rate versus cost per order, trend, and target.
- Working capital impact of inventory aging and stockouts.
- Carrier scorecards with incentives and penalty exposure.
- Freight accruals, audit exceptions, and recovery pipeline status.
- Sustainability indicators: emissions per ton-km and reduction initiatives.
6. Power BI Logistics Dashboard
A Power BI logistics dashboard is a common front-end choice thanks to strong modeling, row-level security, and native drill-through.
Pair it with a governed semantic model and dataflows so changes scale across modules without breaking tiles downstream.
Treat your data model as a product, with owners, backlog, and SLAs.
Power BI Patterns that Scale Well
- Centralized star schemas with conformed dimensions for lanes and SKUs.
- Row-level security aligned to region, site, and partner roles.
- Dataflows for reusable transforms across transport and returns.
- Certified datasets for finance and executive modules only.
- Deployment pipelines and version tags for audit and rollback.
Building Trustworthy Data Architecture and Governance in Logistics Dashboards
Behind every seamless shipment update and accurate ETA lies an invisible engine, the data backbone.
In large operations, the difference between a functional and misleading logistics dashboard often comes down to how data is structured, governed, and secured.
Think of it as the logistics nervous system: if one sensor fails or one rule breaks, the entire chain feels it.
Modern logistics dashboards now integrate governance into their design, ensuring every order, route, and KPI can be traced back to a verified source. This alignment transforms dashboards from pretty visuals into trusted decision systems.
To achieve that, organizations must strengthen four control zones, each designed to keep insights accurate, compliant, and real-time.
Control Zone | Objective | Tools & Practices |
| Architecture Layer | Create a unified, reliable foundation for all logistics data. |
|
| Governance Layer | Maintain quality, accountability, and transparency of every metric. |
|
| Access Layer | Protect sensitive logistics information through granular control. |
|
| Compliance Layer | Guarantee auditability and regulatory alignment across all dashboards. |
|
By designing these four layers together, organizations ensure their logistics analytics dashboards don’t just display numbers- they tell the truth, every time.
Governance becomes the quiet partner of innovation, turning fragmented data into actionable intelligence that scales confidently across fleets, warehouses, and customer networks.
Suggested Reading: Real-Time Logistics Tracking Solutions: Transforming Delivery Visibility in 2026
Implementation Playbook: From First Tile to Enterprise Rollout
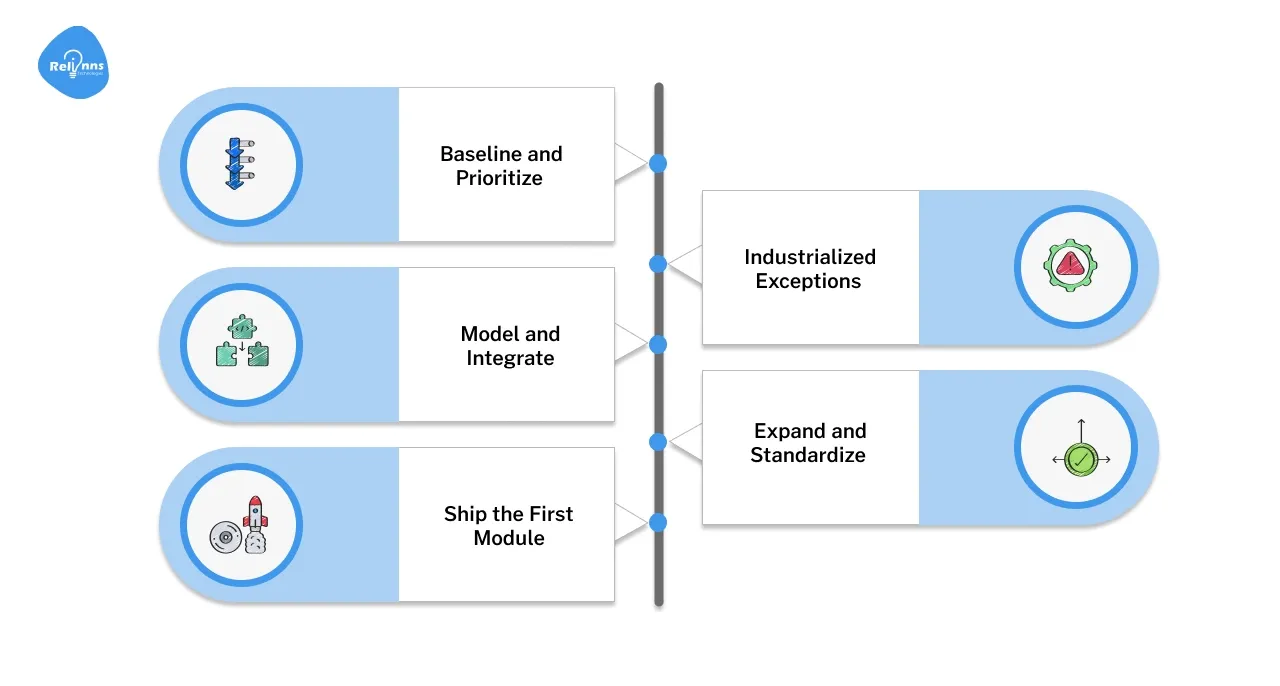
A disciplined rollout keeps momentum high and rework low. Start narrow, prove value, then expand module by module.
The following stages work well in both centralized and federated ops.
1.) Baseline and Prioritize
Interview stakeholders to identify three pains: service variance, avoidable cost, and decision latency. Inventory your current reports, then map each to a future tile or metric inside logistics dashboards.
Define success measures such as OTP improvement, dock dwell reduction, and reductions in return cycle time.
Select one module, one lane, and one region for a 60–90 day pilot.
Actions
- Document KPI definitions, thresholds, and owners.
- Map systems of record and event timing.
- Choose a small but noisy flow for quick wins.
- Draft a one-page charter with scope and KPIs.
- Secure executive sponsor and cadence.
2.) Model and Integrate
Build the semantic model before visuals. Normalize identifiers, time dimensions, and currencies. Connect TMS, WMS, ERP, and telematics systems via APIs and file transfers.
Decide which system wins in conflicts.
Enable near-real-time updates for exception tiles and daily updates for finance tiles. Validate with golden datasets, then lock contracts.
Actions
- Stand up dev, test, and prod workspaces.
- Automate data quality checks and alerts.
- Implement row-level security for partners.
- Document lineage and refresh schedules.
- Create a test pack for KPI reconciliation.
3.) Ship the First Module
Release a minimal transport or warehouse module to real users, not a sandbox demo. Include drill-downs, glossary links, and a feedback button.
Train on “how to act,” not “how to click.”
Review weekly, fix blockers, and capture anecdotes that show time saved or errors avoided.
Actions
- Pair every KPI with a playbook link.
- Add “Explain this KPI” hover text.
- Instrument usage and feature adoption.
- Publish a weekly release note digest.
- Celebrate early wins with screenshots.
4.) Industrialized Exceptions
Turn red flags into guided actions.
Rank exceptions by time-to-breach and cost impact. For each top issue type, add a one-click action that opens the right system with prefilled context.
Measure mean time-to-resolution and share trends to reinforce behavior change.
Actions
- Triage queues by impact, not alphabet.
- Add templates for reroute and reslot.
- Escalate repeated issues with owners.
- Close the loop by logging outcomes.
- Retune thresholds after two sprints.
5.) Expand and Standardize
Clone successful patterns across regions and partners.
Establish a design system for tiles, colors, and filters so modules feel familiar. Promote certified datasets and retire redundant reports.
Create a backlog of features for the next quarter and publish a roadmap.
Actions
- Certify datasets and deprecate overlaps.
- Host monthly KPI office hours.
- Share a public dashboard component library.
- Track adoption and outcome metrics.
- Rotate module ownership to grow champions.
Sample KPI Library by Module in Logistics Dashboards
Every logistics operation needs a clear KPI framework to measure efficiency, cost, and service outcomes. A well-structured logistics dashboard should include separate KPI sets for transport, warehousing, reverse flows, analytics, and finance, ensuring that no metrics overlap or conflict.
These modules form the foundation for performance visibility and process optimization across all logistics dashboards.
Module | KPI Focus Area | Key Performance Indicators (KPIs) |
| Transport Dashboard | Fleet and route efficiency |
|
| Warehouse Dashboard | Fulfillment and inventory velocity |
|
| Reverse Logistics Dashboard | Returns, recovery, and sustainability |
|
| Analytics Dashboard | Forecasting and optimization |
|
| Executive Dashboard | Financial and strategic alignment |
|
Why it matters: Defining KPIs by module ensures that every logistics analytics dashboard and reverse logistics KPI dashboard remains action-oriented, traceable, and aligned to business outcomes, thereby transforming data into measurable progress across your entire supply chain.
Use Cases: Applying Modular Logistics Dashboards in Real-World Operations
Every logistics network faces data fragmentation, which includes scattered telematics feeds, disjointed WMS exports, and inconsistent performance tracking. Modular logistics dashboards bring all that together under a single data model, giving teams live visibility and measurable control.
The following use cases show how analytics-driven dashboards transform daily decision-making.
Relinns – Multi-Location Retail & Logistics Dashboard Implementation
Problem: A regional retailer operating across multiple stores lacked a unified view of stock transfers, shipments, and vendor performance. Manual spreadsheets delayed actionable insight and drove stockouts, excess inventory, and inefficiencies.
Solution: Relinns implemented a low-code platform that integrates inventory, procurement, and logistics workflows, along with dashboards showing real-time stock movement, vendor tracking, and transfer alerts.
Results
- 27 % reduction in inventory holding costs
- 33 % faster forecasting and planning cycles
- 22 % lower average vendor lead time
- 43 % faster cycle counts and audits
Use Case Reference: Relinns Case Study – Inventory Management System
DHL Supply Chain – Global Control Tower Analytics
Problem: DHL needed unified dashboards for its European freight operations, integrating 250+ sites with real-time transport visibility.
Solution: They implemented modular logistics analytics dashboards using Microsoft Power BI and Azure Synapse, merging telematics and TMS data into a live control-tower view.
Results
- 15 % improvement in fleet utilization
- 30 % reduction in exception-handling time
- Real-time visibility across 200 routes daily
Read more here: DHL Analytics Transformation Case Study
Conclusion: Empowering Logistics Operations with Relinns
Modular logistics dashboards are transforming how companies manage visibility, cost, and performance. By connecting transport, warehouse, and reverse flows under a unified analytics layer, organizations move from reactive firefighting to proactive decision-making.
That’s where Relinns Technologies makes an impact. With deep expertise in logistics analytics dashboards, workflow automation, and Power BI integration, Relinns helps logistics leaders design end-to-end visibility platforms that scale securely and deliver measurable ROI.
Why Choose Relinns?
Relinns bridges low-code flexibility with enterprise-grade analytics, turning data into decisive action across your entire supply chain.
- 45% faster deployment of analytics dashboards through modular architecture and reusable data models.
- 33% improvement in data accuracy across multi-site logistics networks via unified governance.
- 29% reduction in operational overhead from automated transport and warehouse workflow synchronization.
- 41 % higher user adoption with intuitive UI and role-based access in Power BI dashboards.
Relinns turns dashboard complexity into operational clarity, helping your business deliver smarter, faster, and more transparently.
Frequently Asked Questions (FAQ's)
How do logistics dashboards improve real-time decision-making?
Logistics dashboards consolidate transport, warehouse, and reverse logistics data into one platform, helping teams spot delays, optimize routes, and make faster, data-driven operational decisions.
What’s the role of a Power BI logistics dashboard in modern logistics?
A Power BI logistics dashboard integrates multiple data sources, updates KPIs in real time, and enables users to visualize performance metrics, driving better forecasting and smarter logistics decisions.
How can companies customize reverse logistics KPI dashboards?
Companies personalize reverse logistics KPI dashboards by focusing on return costs, recovery rates, sustainability goals, and refurbishment performance to manage reverse supply chain efficiency and profit.
Are logistics analytics dashboards beneficial for small logistics firms?
Yes. Logistics analytics dashboards offer smaller logistics companies predictive insights, simplified reporting, and real-time visibility without heavy infrastructure or long deployment cycles.
How do modular dashboards integrate with existing logistics software?
Modular logistics dashboards easily integrate with ERP, WMS, TMS, and IoT systems via APIs, ensuring smooth data synchronization and maintaining unified governance across all logistics modules.
What KPIs should logistics dashboards include for maximum value?
Key logistics dashboard KPIs include on-time delivery, dwell time, cost per shipment, return rate, and inventory accuracy, helping measure performance and improve customer satisfaction.